Chapter 9: Weather Basics
 |
| A line of strong thunderstorms ahead of a cold front. |
When we first started sailing, there was only one source for coastal marine weather forecasts: NOAA weather radio. You’d tune your VHF into one of the Wx channels and listen to The Voice. The droning monotony would put you to sleep instantly. You’d wake up the moment that the forecast you were waiting for was finished, and realize that you’ll have to sit through another cycle of a dozen forecasts to get back to the one for your area. It would often take 3 or 4 cycles to digest all of the information needed. “Did he say southwest 10 to 15 or northeast 20 to 25 after midnight tomorrow?” Things got even worse in the late 1990s when NOAA replaced real human voices with computer-generated speech; the early version of that was impossible to listen to. With the amount of information that’s available today, it’s difficult to believe that we operated like this for so long. But the paucity of weather forecast information forced us to be better weather observers and prognosticators. Over the past couple of decades, we feel that the parts of our brains that used to grapple with weather guessing haven’t been getting enough exercise. But would we willingly give up our weather apps? Not on your life!
Over the past two decades, weather forecasting has improved drastically, thanks to the data collected from a vast network of monitoring stations, weather buoys, radar facilities, and satellites, and to the ever-increasing capabilities of computers to assimilate this firehose of data into complex forecast models, in real-time. The other big change that has occurred over this time is direct public access to forecast information made possible by smart phones and apps. This latter development is both good and bad. Forecast models should never be taken at face value. They still require interpretation, which is best done by experts. But the forecasts made by experts that are readily available are usually not specific enough to your location or to your needs as a mariner. You can pay a forecaster or weather router for custom forecasts (a very good idea if you are into offshore passagemaking) or you can learn some simple tips to help better interpret the output from forecast models.
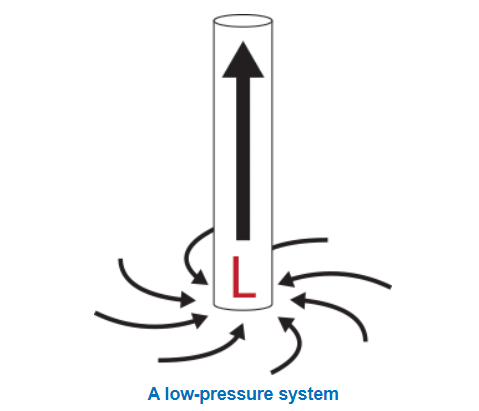
The pressure of the air in the atmosphere varies geographically and over time. These changes in pressure bring about changes in weather. Areas of low pressure usually bring stormy weather: cloudy, wet, windy conditions. As air at the bottom of the atmosphere, near the ground or sea surface, warms, it rises and moves upward in the atmosphere. This creates a vacuum of low pressure at the surface level, which sucks air into it. Low-level air near the Earth’s surface spirals inward, in a counter clockwise direction (clockwise in the southern hemisphere), toward the center of the low pressure. This air at the bottom of the atmosphere, being close to the ground or ocean, is warm and moist. As this warm, moist air converges near the center of the low, it rises higher in the atmosphere. As it rises, it cools and the water vapor condenses, forming clouds. These clouds will grow to hold so much water that precipitation begins to fall back toward Earth.
There are two basic types of low-pressure systems that affect the Southeast and Mid-Atlantic regions of the U.S.: extratropical cyclones and tropical cyclones. Extratropical cyclones are the garden-variety storms that we generally see a couple times each week in this region. They are the most common weather makers in North America, occurring throughout the year, but particularly during the cooler months. We normally refer to them simply as “low-pressure systems.” When the center of one of these extratropical low pressure systems exits the coast and moves over the Atlantic, but stays close to shore, it produces an on-shore wind flow from a northeasterly direction. Extratropical low-pressure systems that follow such a track are referred to as “nor’easters.” These extratropical low-pressure centers originate in the mid-latitudes and are associated with weather fronts.
Tropical cyclones include tropical depressions, tropical storms, and hurricanes. Tropical cyclones originate in lower latitudes over the ocean and are not associated with fronts. They occur during the warmer months, with peak activity in August and September. Tropical weather season is generally thought to be from June to October, but there are an increasing number of these storms developing outside of the normal season.
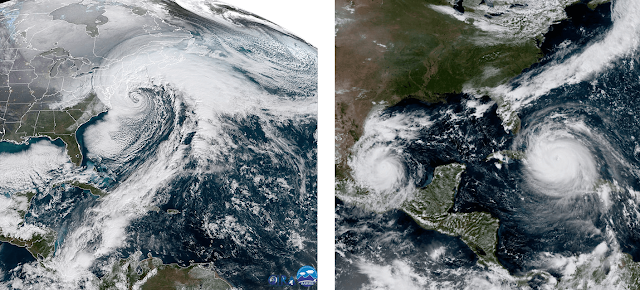 |
| On the left, an extratropical cyclone with its characteristic “comma” shape. The tail of the comma is the cold front. This extratropical low hit the northern East Coast as a nor'easter on January 4, 2017. On the right are two tropical cyclones: Hurricane Katia making landfall in Mexico and Hurricane Irma passing between Cuba and the Bahamas on September 8, 2017. Tropical cyclones are more round and symmetrical in appearance than are extratropical cyclones. Both images are from NOAA's GOES-16 satellite. Credits: NOAA/CIRA (left) and CIRA (right). Source: https://scijinks.gov/noreaster/. |
High-pressure systems behave in a manner that is exactly opposite to low-pressure systems. The high pressure pushes the air that is aloft downward, toward the surface of the Earth. As the number of air molecules build up near the Earth’s surface, they spread outward. As this cool, dry air sinks from high in the atmosphere down to the Earth’s surface, it runs into the ground (or ocean), causing it to spread outward from the center of high pressure in a clockwise spiral pattern. Because high-pressure systems direct cool, dry air from high in the atmosphere toward the ground/sea surface, they are associated with cool, dry, clear, and stable weather conditions with relatively light winds.
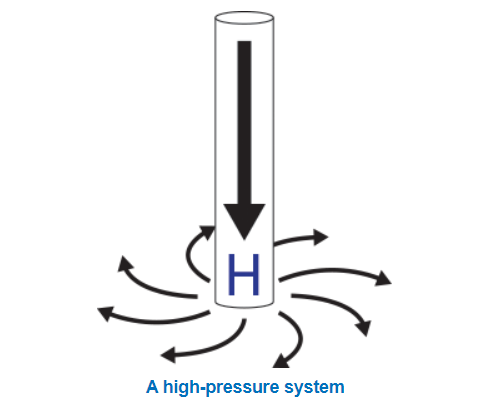 |
| In a low-pressure system, warm, moist air near the Earth's surface spirals inward in a counter clockwise direction. Once that air approaches the center of the low, it rises up into the atmosphere. In a high-pressure zone, cool, dry air from aloft sinks toward the Earth's surface. Once that cool, dry air reaches the ground (or water), it spreads outward in a clockwise spiral. Image credit: NOAA SciJinks https://scijinks.gov/high-and-low-pressure-systems/#:~:text= A%20high%2Dpressure%20system,associated%20with%20clear%20blue%20skies. |
So when you see a weather map that has red “L”s and blue “H”s identifying areas of low and high pressure, keep in mind that these low- and high-pressure systems are three-dimensional and they extend upward from the Earth’s surface, high up into the atmosphere and that these systems are connected to one another by the inflow and outflow of air at their tops and bottoms. Wind circulates around a high-pressure system in a clockwise direction and around a low-pressure system in a counterclockwise direction.
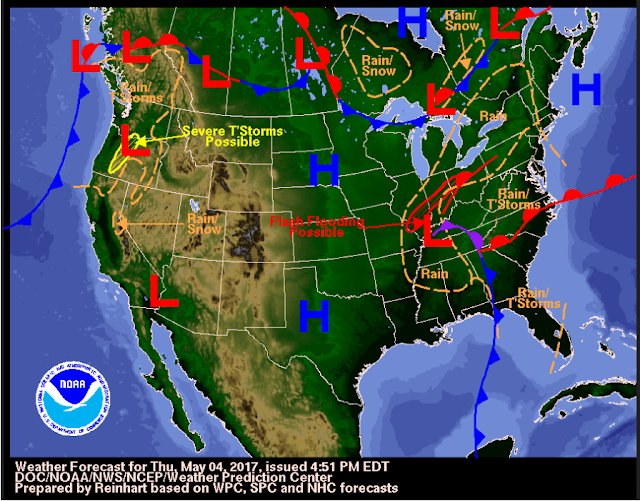 |
| Synoptic maps show major weather features, including areas of high (H) and low (L) pressure, warm fronts (red), cold fronts (blue), occluded fronts (purple), and areas of precipitation. |
In general, extratropical lows move across North America in a west-to-east direction. Once they come ashore on the West Coast, they generally move in an easterly to southeasterly direction until they get close to the Atlantic Coast and then they generally turn toward the northeast. In the cooler months (November through April), the center of the low pressure usually exits the coast between South Carolina and Chesapeake Bay. High-altitude steering currents like the jet stream influence the path of the storm. During winters when the El Niňo is strong (when sea-surface temperatures are above average in the eastern Pacific), the low-pressure systems seem to take a more southerly track, often crossing over Florida or Georgia. The fronts move along in concert with the low-pressure system. So look toward the west and southwest for approaching weather. This is particularly true during the cooler months of the year.
You will hear names for various types of fronts: cold, warm, stationary, and occluded fronts. The truth is that these are all the same thing. The primary difference among them is their direction of movement, relative to the warm and cold air masses. A front (by any name) is simply the boundary separating a warm air mass from a cold air mass. When these large pockets of warm and cold air are close to one another, the change in temperature between them is rapid.
A warm front is a boundary between a mass of cool air and a mass of warm air AND these air masses are moving such that the warm air is moving toward and displacing the cold air. On a weather map, a warm front is usually drawn as a red line with half circles pointing in the direction in which the warm air is moving (i.e., toward the cold air). The passage of a warm front brings warmer temperatures, higher humidity, and increasing clouds.
A cold front marks the separation between an area of warm air and an area of cold air AND the cold air moves toward and displaces the warm air. On a weather map, a cold front is usually drawn as a blue line with triangles pointing in the direction of the warm air that will be replaced. A cold front can bring strong northwest winds, cold temperatures, and clearing skies. A line of strong thunderstorms with torrential rains and high winds (called a gust front) often precedes the cold front, sometimes by many miles.
A stationary front happens when a cold front or a warm front stops moving, and the warm and cold air masses separated by the front remain in one place for a time. On a weather map, a stationary front is usually indicated by alternating cold front and warm front symbols, on opposite sides of the line. A stationary front can resume as either a warm front or a cold front, depending on the direction of its motion, once it resumes its movement. So a cold front can transition into a warm front and vice versa (after spending some time as a stationary front). Stationary fronts can bring long rainy periods that stay in one spot.
If we think of a low-pressure system as being the face of a clock, and the fronts as the hands of that clock, in the Southeast U.S., a warm front would usually extend from the center of the low pressure in the 2:00 to 4:00 direction (extending toward the northeast through southeast from the center of the low-pressure). The cold front usually extends outward in the 5:00 to 8:00 direction (toward the southeast through southwest). This entire system, including the low-pressure areas and the fronts, moves as a unit through the AICW region, generally in an easterly or northeasterly direction. So the warm front usually precedes the cold front. However, cold fronts move faster than warm fronts, and sometimes a cold front catches up to a warm front. When this happens, it’s called an occluded front. The warm and cold fronts come together like the blades in a pair of scissors; they first meet near the center of low pressure and then this occlusion extends further and further outward from the center. In an occluded front, the cold air undercuts the warm air, and the warm air rises, leading to atmospheric instability. Occluded fronts are associated with a variety of weather, but in the Southeast U.S., they often bring severe thunderstorms, hail, and tornadoes. Occluded fronts are drawn as a solid purple line with alternating half circles and triangles pointing in the direction in which the front is moving.
 |
| Symbols for four types of weather fronts used on synoptic maps: A is a warm front (moving toward the northeast), B is a cold front (moving to the southeast), C is a stationary front, and D is an occluded front (moving to the east). |
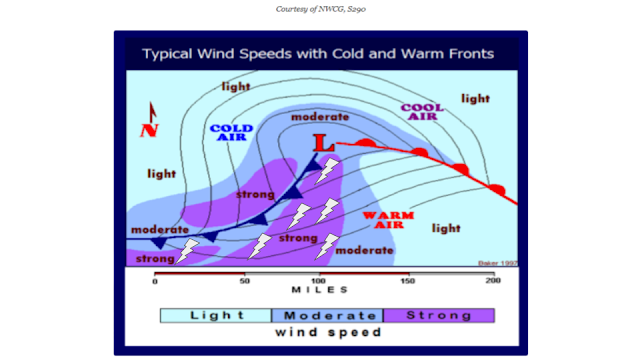 |
| Pattern of wind speeds, thunderstorms, and air temperatures associated with the warm- and cold-fronts trailing from an extratropical cyclonic low-pressure storm system. The concentric black lines are isobars, which outline regions of equal barometric pressure. In general, winds blow roughly parallel to the isobar lines, moving counterclockwise around the center of low pressure, indicated by the “L.” The warm sector is identified in this figure by “Warm Air” and it extends southward from the center of low pressure and lies between the warm front (red) and cold front (blue). The squall line lies within the area of strong wind just ahead (to the right of) the cold front. |
Types of Wind
Wind is simply the movement of air caused by the uneven heating of the Earth’s surface by the sun. As boaters, we are primarily concerned with the horizontal motion of air at sea level. For cruising the ICW, there are two different types of wind that you should keep in mind: gradient winds and convective winds.
Convective winds operate over much smaller regions, driven by heating of a local air mass. When the air warms, it rises higher into the atmosphere, creating a localized vacuum of low pressure in the area from which it departed. Types of convective winds that are relevant to cruising the ICW include daily afternoon seabreezes caused by the heating of the land, winds associated with rising cumulus clouds that cause pop-up thunderstorms, and atmospheric instability associated with fronts and squall lines. Knowing the differences between these two types of wind will make you better at interpreting forecasts.
The apps differ in their prices and user interfaces but, by and large, all of these apps are basically showing you the same information. PassageWeather and PredictWind also offer weather routing, which is not really relevant to cruising the ICW (on the ICW, your route is already set). So just use the app that works best for you. You may find some to be more user friendly or you may prefer the way certain apps display the information. Most of these apps have a free version. Should you fork over the money to get the more advanced version of the app? What are the advantages of having the paid versions? Like everything related to your boat, it’s a tradeoff. It all depends on your resources and priorities. The free versions of the apps may offer fewer forecast models from which to choose, may limit the forecast period for some of the longer-term models, and may limit the time resolution of the models (e.g., show time steps of 3 hours instead of 1 hr). One big difference between the paid and free versions of many weather apps, a difference that is often overlooked by users, is the frequency with which model runs are updated. The free versions often do not give you access to all runs of a model. Therefore, if you are using the free version of a weather app, you may not be getting the most recent forecast information.
What is a weather model?
A forecast model is simply a set of very complicated mathematical equations. These equations have thousands of variables, which include factors such as atmospheric pressure, temperature, humidity, and wind speed at many locations and altitudes around the globe. These variables are changing constantly. So the ability of a forecast model to predict weather conditions diminishes the further out into the future you try to predict. These models are run multiple times per day, each time with updated information for each variable. For example, the ECMWF model is run 4 times every day, roughly every six hours. But the free versions of the apps don’t show the results from every updated run of the ECMWF model. If you use the free version of an app, it may only update the ECMWF model results once or twice per day. So, most of the time, when you use the free versions of the apps, you are going to be looking at outdated model runs. The paid versions of the apps will show results from all of the model runs.
Regardless of which app you use, and whether it is the paid or free version, you need to pay attention to which model is being used to generate each forecast prediction and to the time at which the model run was initialized. That time of initialization will be between 0 and 24 hours in the past (usually expressed as Zulu time or Greenwich Mean Time). The older a forecast model run is, the less confidence you should have in it. You may notice slight differences between the forecasts given by different apps for the same model. The most likely reason for this difference is that the apps are showing you results from two different runs of that model. This is most likely to happen if at least one of the apps you are using is a free version. You can look at the metadata for each model run, which tells you the time at which the run was initialized. For example, in Windy, click on the “i” information button in the lower right corner, which opens a window that tells you the time that the model was initialized.
Why are there so many models? Can I just use one?
Given the limits in computing speeds, there are tradeoffs that need to be made between general applicability and specificity of the model. That is, you can make a model that provides very specific, correct predictions about the weather under very specific conditions. But when conditions change, that model may provide very specific predictions that are erroneous. So that model is only useful some of the time. On the other hand, you can design a model that provides less specific predictions but those predictions will be correct under a broader range of circumstances. Modelers must attempt to balance this tradeoff between accuracy/generality and precision/specificity.
Model designers are forced to make decisions on how to allocate the finite computing resources, otherwise the mathematical calculations that go into the model will take too long to complete, even with the most powerful super-computers. The sorts of choices that the modelers have to make that affect the amount of time needed to run the model, given the limits to computing power, include things such as the: (1) geographic extent of the model’s coverage (global versus regional), (2) model’s resolution (which varies from a high resolution of 3 km to a low resolution of about 25 km in today’s commonly used models), (3) forecast period (which ranges from 48 hours to 14 days into the future), (4) time step (1 - 4 hours; the model results are usually depicted as an animated video comprised of many snapshots in time. The closer together in time that these snapshots are taken, the smoother is the "video," and the more precise are its predictions), and (5) the update frequency or time interval between successive runs of the model. (The number of times that the model can be run each day depends, in part, on how long it takes to complete each of these runs.)
No single model can accurately predict the weather under all circumstances. So lots of different models have been developed to cover different weather scenarios. For this reason, it is important to pay attention to multiple models and to which model is currently doing the best job of predicting weather under the prevailing conditions.
Link to table showing attributes for each of 12 weather forecast models.
Link to table showing which forecast models are used by each of seven popular weather apps.
Global vs. Regional Models
Models vary in their geographic coverage. For example, the GFS and ECMWF (AKA, the “European Model”) are global models that have relatively low spatial resolution, and focus on large-area weather events, such as those associated with high- and low-pressure systems. Their wind forecasts are only for gradient winds. For the most part, the global models do not forecast winds generated by convection (i.e., localized winds caused by heating and cooling of the land and atmosphere, such as from sea breezes or thunderstorms). The NAM and HRRR are “mesoscale” models covering just the North American region. These two regional models are more precise, having higher spatial resolution. And they have greater predictive power when localized convective winds are present. But their forecasts are limited to just North America and the time range of their forecasts is shorter (HRRR = 2.25 days, NAM = 3.5 days, ECMWF = 10 days, GFS = 16 days).
Most forecast models do not show fronts. So the instability in the atmosphere (i.e., wind) associated with a front is not accurately reflected in the model’s output. Some of the apps superimpose fronts on top of the model output, but the effects of those fronts on wind conditions are not actually incorporated into the model results. Showing the location of a front in this manner is simply a visual indicator of where there is instability in the atmosphere and greater uncertainty in the wind forecast.
NOAA Marine Forecasts
NOAA is the parent agency of the National Weather Service, which creates and curates many of the familiar forecast models. And, of course, they use these models to create their weather forecasts. NOAA’s professional meteorologists, who know all the idiosyncrasies of each forecast model, synthesize the information from all of the models, as well as from actual weather observations to make their descriptive text forecasts. (Find local forecasts for any region of the country, including marine forecasts here.) Compared to the models on which they are based, these text forecasts are made at relatively coarse geographic and time scales. So these marine forecasts may not correspond perfectly with your forecast needs. But they are good benchmarks to make sure your forecast interpretations are at least in the right ball park.
In these NOAA marine forecasts, pay particular attention to any mention of showers and thunderstorms. Also, look for a phrase similar to the following: “Winds and waves higher in and near thunderstorms.” If you see this phrase anywhere in the forecast, know that there are large uncertainties in the wind predictions for the time periods when showers and thunderstorms are predicted. Expect higher wind speeds than those given in the forecast during the time periods when showers and thunderstorms are predicted.
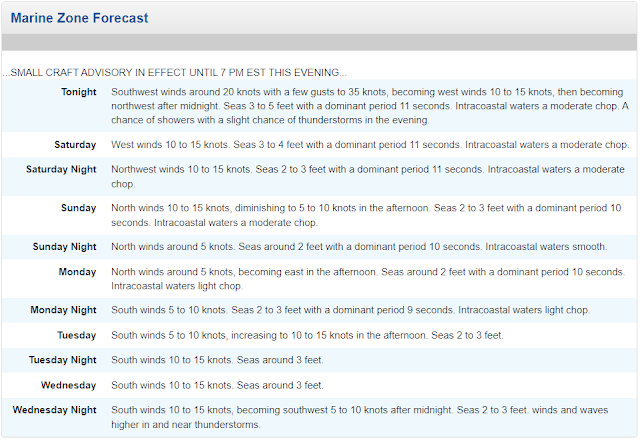 |
| NOAA’s coastal marine forecast for the waters from Jacksonville to St. Augustine, Florida, out to 20 nautical miles offshore as of 3:00 pm (local time) on February 24, 2024. (Coastal marine forecasts from Daytona, FL, to Savannah, GA can be viewed here: https://www.weather.gov/jax/) |
The figure above is an actual NOAA marine weather forecast, for the coastal waters of northeast Florida. The first point to be made is that the wind speeds given in these forecasts are for the sustained winds, unless they specifically state the speeds of wind gusts (as in the first line of the forecast statement for “tonight”). When gusts are omitted from the forecast, you may experience occasional gusts that are significantly higher than the forecasted (sustained) winds. The gusts get your attention, more than do the sustained winds. You may look at the gusts and think, “Boy, NOAA really blew the forecast again.” Just remember that the forecast is generally for the sustained winds, not gusts.
The most important information in this entire forecast comes in the very last sentence at the end of the final forecast period: “Winds and waves higher in and near thunderstorms.” Thunderstorm cells generate their own convective winds. Remember that many of the forecast models are not designed to predict the localized winds from thunderstorms; they only predict the larger-scale gradient winds. So these localized winds, which can be really strong, often get down-played in the forecasts. As a consumer of weather forecast information, you have to always be on the lookout for clues and key phrases that indicate the possibility of strong, damaging winds.
That statement at the end of the Wednesday forecast trumps everything in the forecast for the time period when thunderstorms are expected. Despite the placement of this sentence, it does not mean that there will be thunderstorms during Wednesday night. That final sentence refers to the entire forecast period, not just for Wednesday night. It means that whenever thunderstorms are predicted to occur, the wind and waves are likely to be higher than what is given in the forecast. In this case, thunderstorms are predicted for “tonight” (Friday night). The winds and seas for Friday night are predicted to be from the southwest at 20 knots with gusts to 35 knots, becoming west 10 to 15 knots, then northwest 10 to 15 knots after midnight. Seas in the ocean are predicted to run 3 to 5 feet and there will be a moderate chop on the ICW. In total, this forecast (including the very final sentence) is telling you that early on Friday night, you should see sustained winds of AT LEAST 20 knots with gusts to AT LEAST 35, but that you may experience winds that are MUCH HIGHER than this when the thunderstorms are passing through. If you do not know how to interpret the messaging from NOAA, you will likely underestimate the predicted wind strength. Always look for the phrase “Winds and waves higher in and near thunderstorms” and know that it applies to any time period within the forecast during which thunderstorms are predicted.
 |
| 1. A wind map generated by the ECMWF model and displayed in Windy. At first glance, there doesn't seem to be anything special. There is an area of low pressure way up over the Great Lakes but it doesn't seem to be generating a lot of wind, and the winds over the entire Southeast region appear to be light. The thing that may catch your eye is the "kink" in the barometric pressure isobars. The isobars look like an arrow pointing toward the south from the low pressure center. Where the isobars are kinked, or make a sharp turn, indicates the location of a front. Remember that the forecast models don't show fronts (although some apps superimpose the fronts on top of the model's graphical output). You have to infer where the fronts are located, based on the shapes of the isobars. |
 |
| 2. The graphical output of the ECMWF for the area in St. Simons Sound, GA (near Brunswick), doesn't seem too remarkable at first glance, either. It shows thunderstorms (indicated by rain and lightning) for the period from between about 1:00 and 7:00 PM on Sunday, March 9. But the forecasted wind speeds were nothing to write home about. Sustained winds were not predicted to get above 15 mph, gusting to only about 22 mph. Kind of seemed like a nice day for a brisk sail. But remember that the ECMWF only predicts the gradient winds, not convective winds. And that cold fronts and thunderstorms produce a lot of convection. |
 |
| 3. So our next stop is with the synoptic weather map. Now things are beginning to look a little more interesting. That low pressure over the Great Lakes does indeed have a cold front hanging from it, and it extends all the way down and across the Gulf of Mexico. And it turns out that there are two other smaller areas of low pressure riding along that front, one that was just to our north. Widespread rain/thunderstorms were forecast for the entire Southeast and severe thunderstorms are possible from the Florida Panhandle, across the coastal plains of Georgia and South Carolina, and up into North Carolina. And this forecast map was issued at 3:37 AM, on the morning of March 9. |
 |
| 4. As the squall line and cold front approached at about 1:15 PM, we looked at the NWS radar from Jacksonville and saw severe thunderstorms marching in our direction. |
 |
| 5. At that same moment, we were under a tornado watch on the south coast of Georgia. |
You can’t take forecast models at face value and can’t simply rely on a single model. You need to synthesize a large amount of information to interpret the forecast models. Therefore, you need to take a logical, systematic approach to interpreting model output. Here is what we suggest.
1. Focus on the wind forecasts, not the wave forecasts, for the ICW. Wave heights on the ICW vary tremendously over relatively short distances, depending on the amount of fetch and the direction of the current relative to the wind. Secondarily, look at the precipitation forecast to understand how it will affect visibility and as an indicator of uncertainty in the wind forecast. (Wind forecasts are often underestimated for periods during showers and thunderstorms.)
2. Compare forecasts from a variety of different models, including both global and regional models. If all the models are in general agreement about the conditions predicted for your area, you can have confidence in those predictions. If the forecasts differ among models, then you need to do some work to figure out what scenario is most likely to occur. Keep in mind that most forecast models, including all of the global models, completely ignore convective winds.
3. If the regional models, such as the NAM and HRRR, are predicting higher wind speeds than the global models (GFS and ECMWF), try to figure out if convective winds are likely for your area. For example, is there a front approaching or are thunderstorms likely to occur during the forecast period? If so, the GFS and ECMWF may underestimate wind speeds. In such cases, the regional models will probably perform better.
4. With every new run of each model, look to see if there are any major changes in the forecast since the previous run. Relatively large changes in the predictions for your area from one run of a model to the next is a red flag indicating a large degree of uncertainty in the forecast. For example, if three successive runs of the GFS model all predict the same wind speed and direction for your area for a specific time, you can be fairly confident in that forecast. If the other models also agree on this outcome, then you can have a very high degree of confidence. In contrast, if the 2024-02-13T00:00:00Z run of the GFS model (i.e., the run of the GFS model that was initialized at 12:00 AM on February 13, 2024, Greenwich time) predicts 25-knot winds from the NE at 6:00 PM local time on February 15 in your area but then the next run of the same model, which was initialized at 2024-02-13T06:00:00Z (i.e., 6:00 AM on February 13, 2024, Greenwich time), predicts 8 knots out of the SW at 6:00 PM local time on February 15th for your area, you know that there is a large amount of uncertainty in the forecast. And if you simply take the more recent forecast at face value (8 kt from the SW), you could be in for an unpleasant surprise. Study subsequent model runs as they become available to see if the forecast changes again.
5. Compare the predictions from all the models to the actual weather conditions you are experiencing. Take the results from model runs that were initialized at some point in the past and that made predictions for the current point in time. Compare these model predictions for the weather at the current time to observations of the actual weather made at the current time. These observations of weather can be your own observations or you can get them from weather buoys, weather stations, or airports (see the NOAA National Data Buoy Center). Which model has been performing the best? If one particular model is clearly outperforming the others at this particular place and time, then put more faith in that model’s predictions in the near future.
6. Once you have created a picture of the coming weather conditions from the models, compare this to NOAA’s marine forecast for your area (Go here to find local forecasts for any location in the country: https://www.weather.gov/). NOAA’s text forecasts are made at relatively coarse geographic and time scales. But if their forecast doesn’t agree in general with what you think is going to happen, try to figure out why they are different. Pay particular attention to any mention of showers and thunderstorms. Also, look for key phrases like: “Winds and waves higher in and near thunderstorms.” If you see this phrase anywhere in the forecast, know that there are large uncertainties in the wind predictions for the time periods when showers and thunderstorms are expected to occur. Prepare for higher wind speeds than those given in the forecast during the time periods when showers and thunderstorms are predicted.
If in doubt, just walk down the dock and see what the other boat crews think about the weather.
Understanding the basic “anatomy” of weather phenomena will help you understand what’s going on and allow you to better predict what conditions will be in store for you. Similarly, understanding the language used in the NOAA marine forecasts, and the difference between a weather app and a forecast model, will help you interpret forecast information.
- Coastal and Offshore Weather: The Essential Handbook by Chris Parker
- NOAA National Weather Service - Local Forecasts Throughout the Entire Country (including coastal marine forecasts)
- NOAA National Weather Service - Coastal/Great Lakes Marine Forecasts by Zone (same forecasts as provided at the above web site, but they come with a synopsis of the features influencing the weather during the forecast period.)
- NOAA National Hurricane Center Tropical weather forecasts and storm tracking.
- NOAA National Data Buoy Center Get real-time and historical data from weather and oceanographic data buoys and coastal monitoring stations.
- Introduction
- Chapter 1: Tips & Tricks
- Chapter 2: Water Levels
- Chapter 3: Avoiding Obstacles
- Chapter 4: Running Aground
- Chapter 5: Bridges
- Chapter 6: Inlets
- Chapter 7: Docking, Anchoring & Mooring
- Chapter 8: Navigation Electronics
- Chapter 9: Weather Basics
- Chapter 10: Typical Weather
- Chapter 11: Environmental Stewardship
- Chapter 12: The Perfect Boat
- Chapter 13: Maintenance
- Chapter 14: Conclusion
- About the Authors
